Request lifecycle
Architecture live
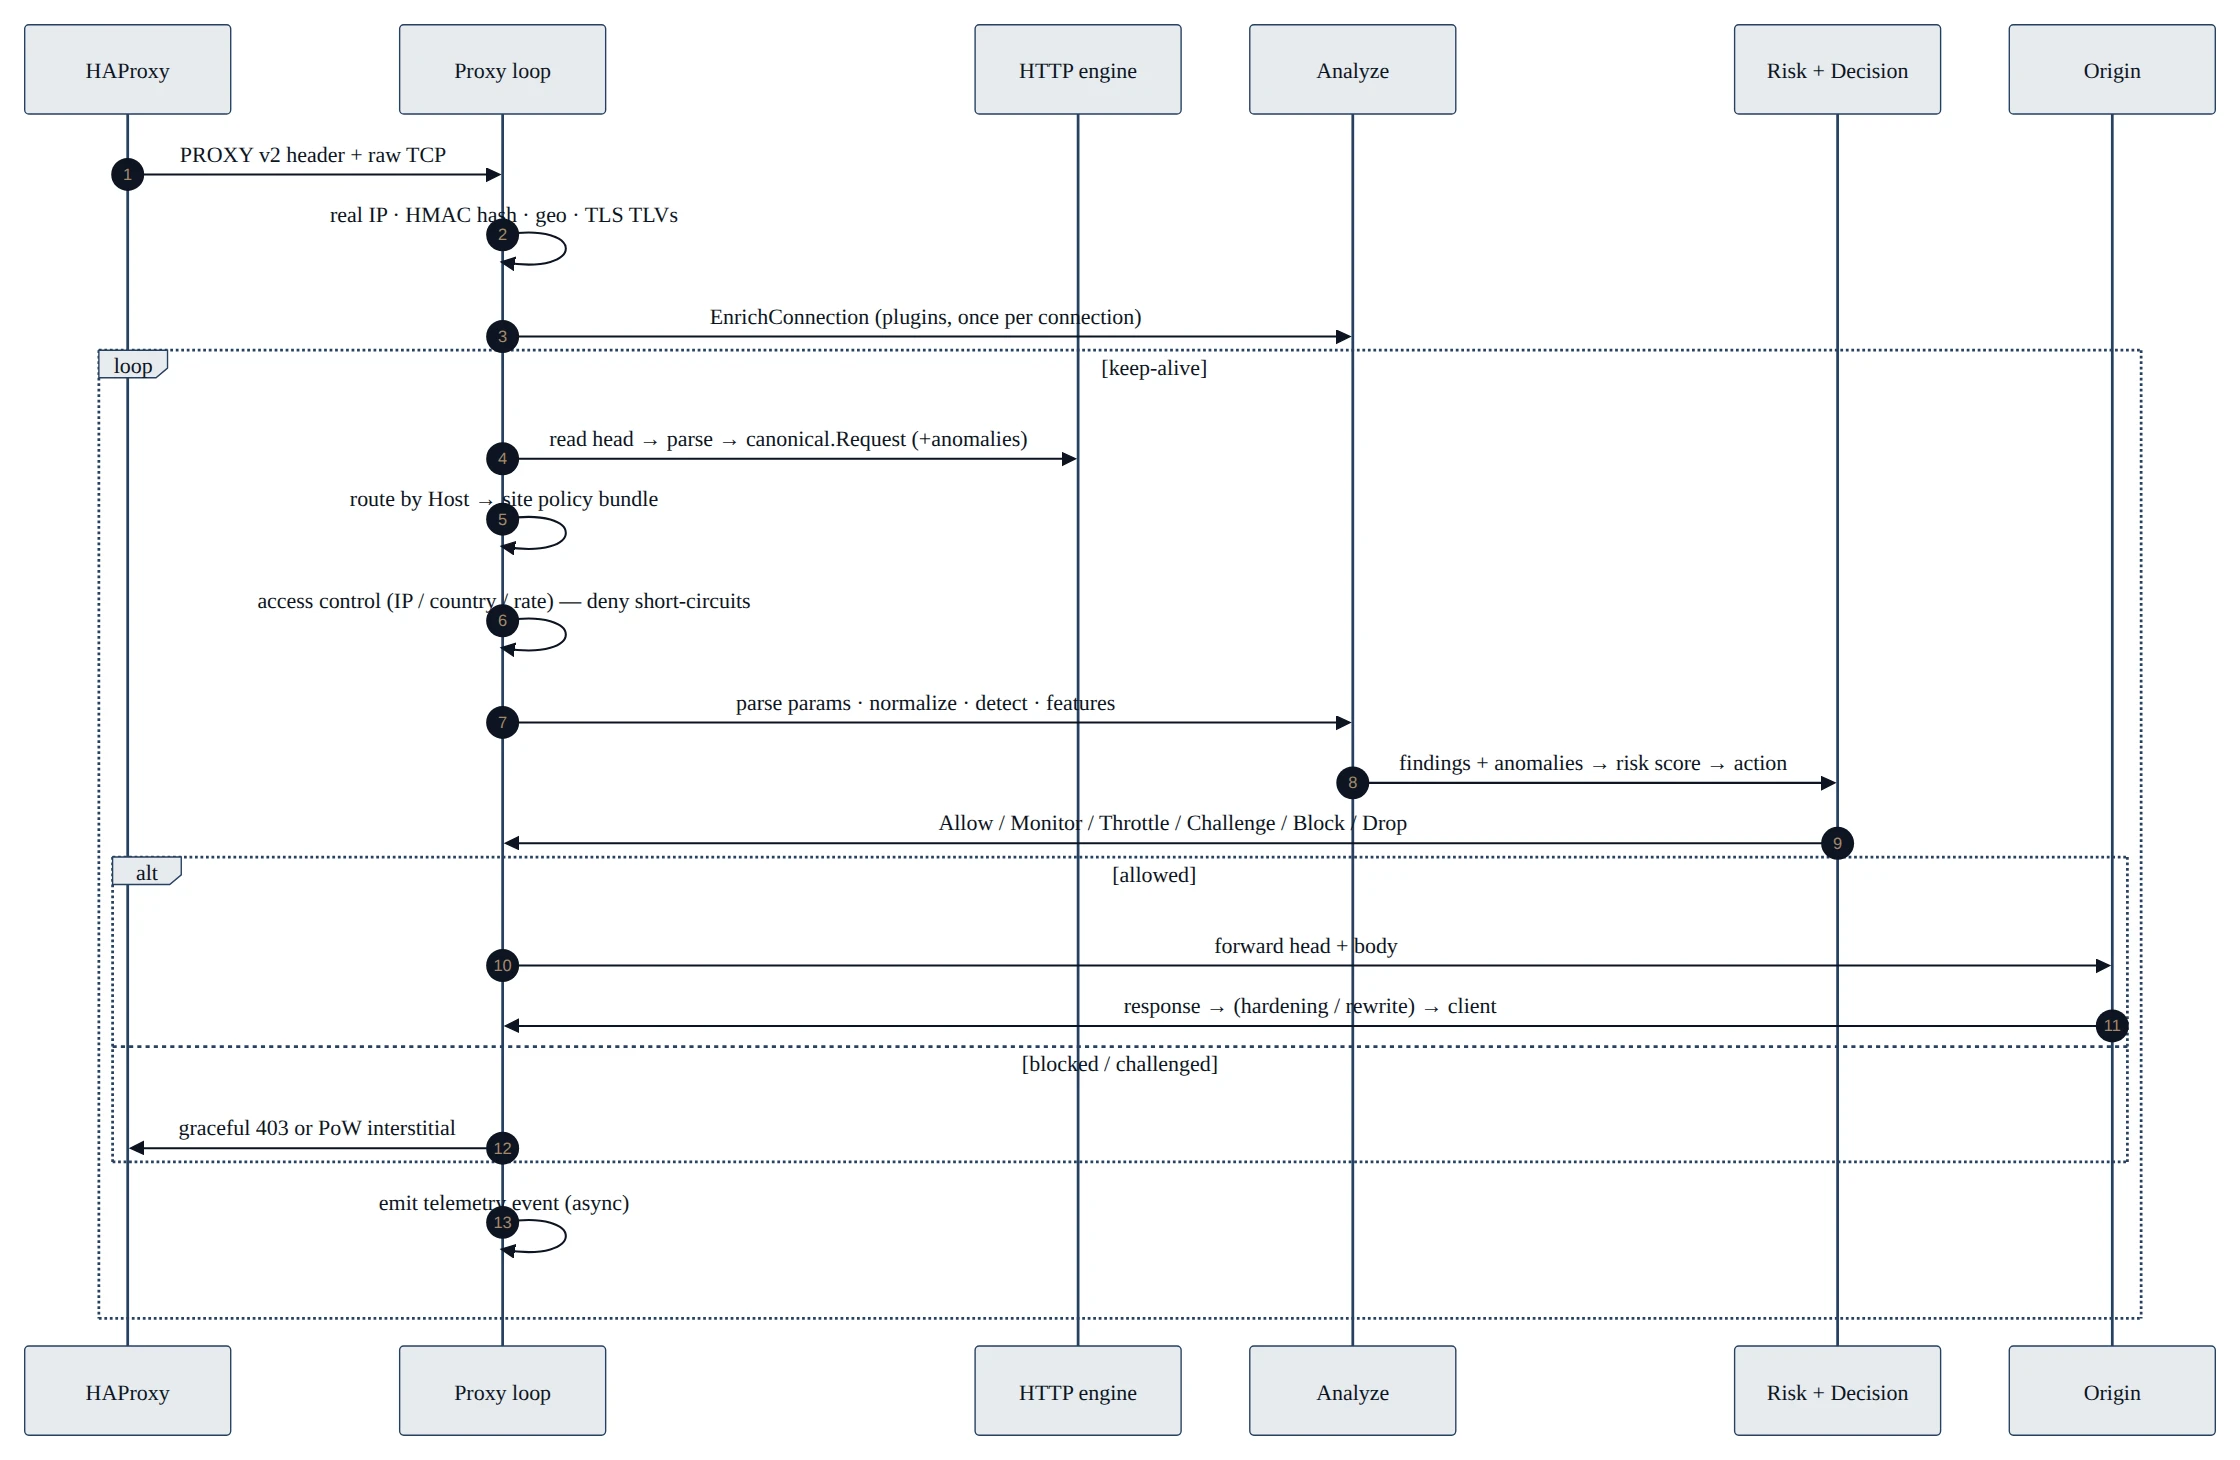
This is the whole engine in one walk — what happens to a single request from the moment HAProxy hands over the connection to the moment the response goes back.
End to end
Stage by stage
-
Accept & identify. The accept loop admits the connection (subject to a max connection gate), reads the PROXY v2 header for the real client IP, HMAC-hashes the IP for telemetry, tags the country from the GeoIP file, and — if plugins are present — parses the TLS TLVs (JA3/JA4/SNI/version).
-
Connection enrichment. Once per connection, the engine calls each connection-level plugin's
EnrichConnectionwith that context. Browser Identity classifies the TLS stack here; the findings are cached for every request on the connection. -
Parse the head. For each request in the keep-alive loop, the HTTP engine reads until the head is framable and parses it into the canonical request, setting any framing anomaly flags (smuggling, duplicate host, obsolete folding, …). HTTP/2 is detected and served through its own path.
-
Read a body window. If the request declares a body, a bounded window of it is read before the decision —
min(-body-inspect, Content-Length)bytes, never past the declared length, never longer than-body-timeout. Without this step body inspection would depend on packet boundaries: a client that writes the head and the body separately would leave every engine with nothing to read. Chunked bodies are de-chunked for inspection, andgzip/deflatebodies are inflated into a scratch buffer — bounded by the same window and a 64:1 ratio cap, so a compression bomb yields a windowful and stops. The origin always receives the original bytes; only the inspection copy is transformed. -
Route. The
Hostheader selects the per-site policy bundle (origin, thresholds, enabled engines, access rules, edge behavior). Unmatched hosts fall back to a default. -
Access control. Allow/deny by IP, CIDR or country, plus per-client rate limiting and adaptive auto-ban, run before detection. A denial short-circuits straight to a block (and its own telemetry event); an allowlist entry can bypass the WAF entirely.
-
Analyze. The core of the request path:
- Parse params — the relevant protocol parser (query, form, JSON, multipart, GraphQL, XML; SOAP and JWT are always attempted) flattens inputs into Source-tagged Params.
- Normalize — every Param's raw value and the path are reduced to canonical form (percent/entity decode, NFKC, homoglyph fold, whitespace, lowercase).
- Detect — the engine registry runs each detection engine over the Params; custom-rule and plugin findings are merged in.
- Features — entropy, depth, token and non-ASCII statistics are extracted for telemetry and ML.
-
Score. The risk engine combines all findings (weighted by engine weight and confidence) and all anomaly flags into one saturating total.
-
Decide. The decision engine maps the total to an action through the threshold ladder. In shadow mode anything stronger than Monitor is clamped to Monitor — nothing is blocked — while the decision still records what enforcement would have done.
-
Act. Allow/Monitor forwards to the origin; Throttle tarpits; Challenge issues a proof-of-work interstitial; Block/Drop returns a graceful
403(even mid keep-alive). -
Telemetry. Every request — clean or flagged — emits one anonymized event to the async sink: the pseudonymized client hash, country, risk totals, the effective and would-be actions, features, findings, and (for flagged requests) a bounded evidence span mapped back to the raw bytes.
The shadow nuance
Inspect everything, block nothing — until you choose to
With -enforce=false (the default) the request is fully analyzed and
telemetered exactly as in enforce mode, but Decision.Action is clamped to
Monitor so traffic is never blocked. The field would (a.k.a.
ShadowAction) records the action enforcement would have taken. This is how
you measure the false-positive rate on your own traffic before switching a site
to enforce.